About the project
dChan is an open source project created and maintained by the Q Origins Project. The website is powered by Django (hence the name).
What am I looking at?
In case it wasn't clear, we do not endorse the content of any posts archived here, nor do they reflect the opinions of members of the Q Origins Project. Posts in the archive are sourced from some of the darker corners of the Internet and are being collected automatically for the purpose of analysis only. As such, a general content warning applies site-wide. Please report illegal or suspicious content to the webmaster.
About the data
The data comprising this archive—a total of over 22,000,000 posts—was mostly scraped from 8kun and archive.is. 4chan threads were collected from the 4plebs API. Where possible, the original HTML of posts was preserved and then parsed into a format resembling what the original users would have typed to create formatted text.
Acknowledgements
This project was largely inspired by Fredrick Brennan, original creator of 8chan who now works to expose and deplatform the people behind the Q phenomenon. He has also contributed crucial data and code that made this project possible. Additionally, Fred created several of the fonts used on this website and on QOriginsProject.org, including TT2020 and FRB American Cursive, both free and open source.
About the time series visualizer
The time series visualizer is a powerful tool for exploring the Q-related imageboard posts for trends and correlations, but there are some caveats to be aware of when doing so.
Identifying trends in the data
When using the time series tool to find trends in topics, it's important to understand what you're looking at. Consider a scenario in which you're trying to identify trends in the usage of the term "LARP" on the Q boards.
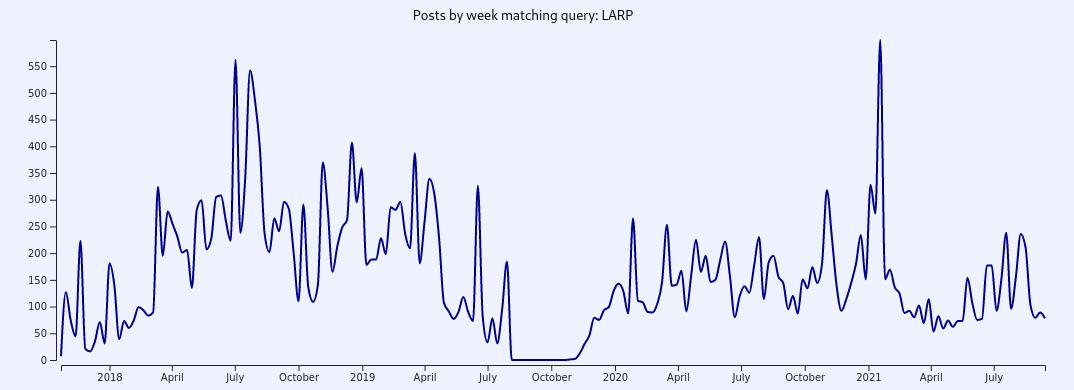
At first glance, it would appear that the term gradually came into use, peaking around mid 2018, and then spiked again in early 2021. However, this relies on the assumption that all of the data is evenly distributed. In reality, the volume of posts we have archived is distributed like this:
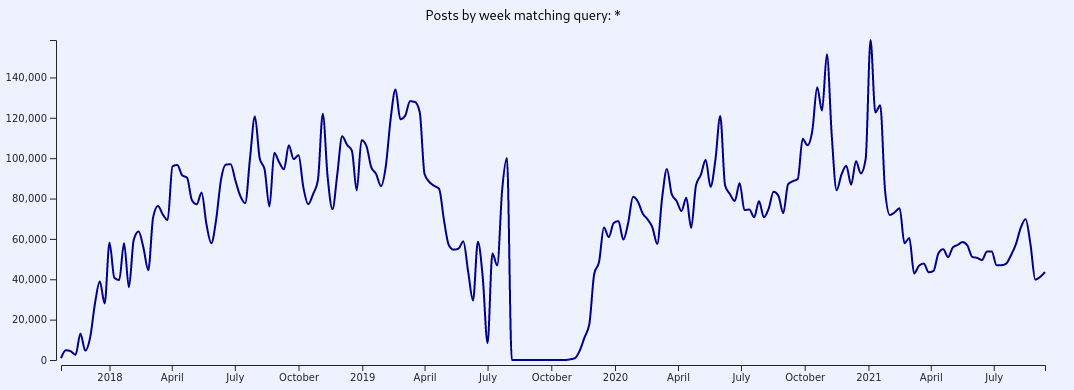
This means that any search term is inherently biased towards this distribution by virtue of the fact that there is simply more data for certain points in time than others. You may also notice that there is a gap from August to November of 2019. This was the period between 8chan going offline and 8kun coming online.
To account for the uneven distribution of posts in the database, it is almost always preferable to use "per 1000 posts" mode for identifying trends like this. This mode controls for the distribution of posts by dividing the number of matches in each "bucket", or time slice in the histogram, by the total number of posts archived for that period, and multiplying by 1000. The result is that Y values become normalized to values between 0 and 1000, each representing the "per mille" concentration of matching posts for each bucket.
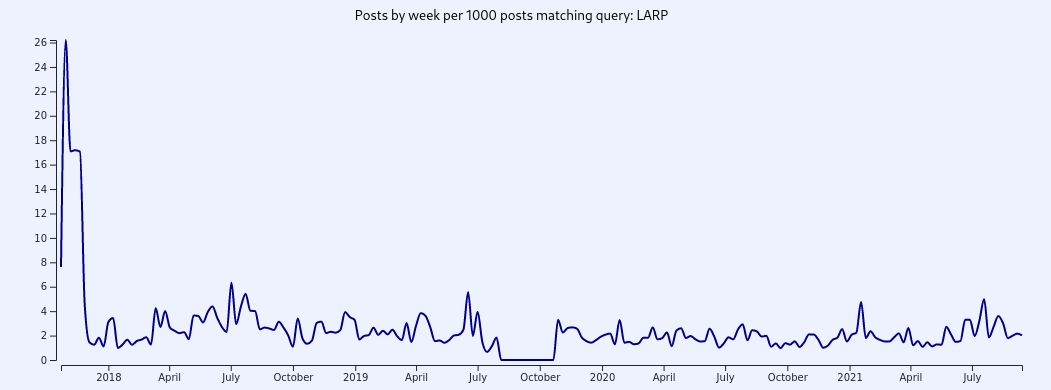
After controlling for the uneven distribution of collected data, it appears clear that usage of the term "LARP" was much more common on 4chan and quickly fell off after the 8chan switch, where it remained more or less constant. Not so fast—there is another caveat here. Due to some technical differences between data collection on 4chan and 8kun, the archive currently only contains 4chan threads in which Q posted, while 8chan and 8kun data has been archived beginning with Q threads and branching out to many threads that were linked from those threads. In fact, there are over 20,000 8chan/8kun threads archived, most of which do not contain Q posts. It is reasonable to believe that users would be more inclined to use the term "LARP" in threads where Q was posting. In short, this is an example of selection bias and more thorough investigation should be done to determine whether this trend remains visible when comparing only Q threads.
Identifying spikes in the data
When exploring different search terms, you may notice pronounced spikes in usages for certain days or weeks. You should always take these with a grain of salt before assuming they show a spike in interest in a topic.
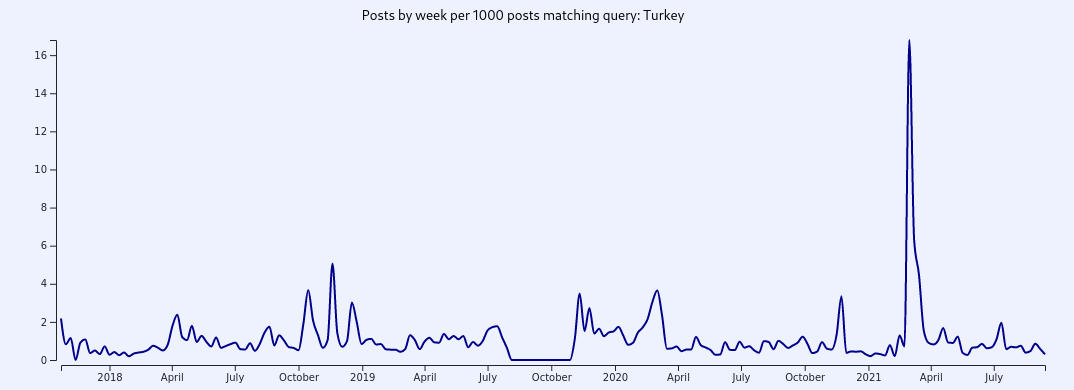
This spike appears very significant even in "per 1000 posts" mode. However, upon auditing the actual posts matched for the week of March 1, 2021, it is immediately clear that this spike mostly shows inauthentic bot activity, not organic conversation.